

.webp)
As the global economy operates in a deeply digitalized landscape in 2026, the advantages of data-driven decision-making (DDD) are indisputable. Despite the widespread availability of AI, the substantial costs of implementing bespoke Big Data analytics often mean its most powerful applications remain concentrated in large enterprises. To bridge the knowledge gap regarding how these advanced tools scale down, the National Bureau of Economic Research (NBER) in Cambridge, Massachusetts, sought to evaluate the impact of data analytics on small business performance. By analyzing merchant behavior during the phased rollout of the eBay Seller Hub (SH), NBER researchers utilized this deployment as a definitive field experiment.
DATAFOREST knows how to handle Big Data; arrange a call, and you will know too.
The Past and the Future of the B2C
eBay is a global online marketplace that allows individuals and businesses to buy and sell various goods and services. The platform was founded in 1995 and has since become one of the world's largest e-commerce websites, with millions of active users and billions of dollars in sales annually.
It operates on a platform model, where buyers and sellers transact directly with each other for the exchange. eBay offers a range of features and tools to help sellers manage listings, optimize sales, and engage with customers; while providing buyers a convenient and secure way to purchase goods and services online.

Seller Hub helps sales
The Seller Hub launched in 2016 using eBay's experimental platform. A key feature of the rollout was that randomly selected groups of vendors were given access to the tool in seven phases. The key components are:
- Dashboard provides an overview of sellers' current performance, shipping status, and other vital metrics.
- The Listings Manager allows sellers to create, edit, and manage their listings in one place. Sellers can also use it to research keywords and trends, optimize their listings, and schedule promotions.
- The Orders Manager provides a centralized location for sellers to manage their orders — history, track shipping information, and print shipping labels. Sellers can also manage returns and refunds directly from the platform.
- Performance Metrics: eBay Seller Hub provides detailed sales performance analytics, including sales metrics, customer feedback, and defect rates. They can use this data to identify areas for improvement and optimize their sales strategy.
Performance Measurement


They easily understand industry-specific data and KPIs, and their efficiency as a team allows them to deliver results quickly.
- Marketing Tools help sellers promote listings and increase sales. These include listing promotions, email marketing, and promoted listings.
- Seller Protections against fraudulent buyers, payment disputes, and other issues that may arise during the sales process.
- Educational Resources include articles, webinars, and videos on shipping, taxes, and customer service.
To understand the role of Seller Hub, a year before the platform's launch, NBER collaborated with eBay to survey merchants about the components of DDD. The study of the causal effect of Seller Hub was based on a generalized difference-in-differences (DID) specification. The results of extension groups with and without SH access are compared weeks before and after access.
The Historic 2016 Seller Hub Rollout
Looking back from 2026, the phased deployment of the Seller Hub in 2016 stands out as a pioneering, randomized field experiment in e-commerce data strategy. During that time, eBay strategically expanded its user base by inviting targeted business sellers to register over a multi-month period.
- Between May 12 and July 26, 2016, selected sellers received email invitations on specific days to create six distinct ramp-up groups.
- The initial May 12 group included 6,301 sellers assigned by the hashed user ID digits (uid_mod) 00-02.
- Subsequent phased rollouts occurred on May 19, June 6, June 13, June 21, and July 26, systematically grouping tens of thousands of sellers by their respective uid_mod numbers.
- The initial experimental phase officially concluded on August 8, 2016, when the final 56,303 US business and professional sellers (uid_mod 66-99) were invited to join the platform.
- Because the assignment relied strictly on hashed user IDs, the rollout effectively served as a rigorous, randomized step-design experiment.
Optimize inventory and boost sales with advanced forecasting!

The Setting of the Experiment
The main background of the NBER field experiment conducted by eBay Seller Hub is the desire to help small businesses become successful. As one of the largest online marketplaces, eBay provides small businesses access to a global market and a wealth of data and resources. However, navigating this environment can be challenging, particularly for sellers who are just starting or need more experience with data analysis and optimization.
The Seller Hub was designed to address this challenge by providing small businesses with data-driven insights and personalized recommendations that could help them improve their sales performance on the platform. The NBER field experiment was conducted to evaluate the impact of the Seller Hub rigorously and to determine whether it was a cost-effective intervention for improving sales performance among small businesses on eBay.
What methods were used?
Here are the methods used in the NBER field experiment conducted by eBay:
- The study used a randomized controlled trial design where eBay sellers were randomly assigned to a treatment or a control group to test the impact of the analysis.
- The treatment group received a free search optimization analysis that included personalized recommendations on how to optimize their listings for search engines and increase visibility.
- The control group did not receive any additional support or analysis.
- The study collected data on sales and other relevant metrics for both groups from eBay's database.
- The study used statistical analysis to compare the sales of the treatment group with the control group and estimate the causal impact of the research on sales.
eBay surveyed in November 2016 received 304 responses from business sellers, 163 Seller Hub supporters, and 141 non-participants. All survey respondents belong to the B2C entrepreneur segment – small business sellers with annual sales between $10,000 and $120,000; sellers from this segment accounted for 89.7% of big panel data.
Salespeople were asked to evaluate the availability of decision support data, the use of data for decision-making, and performance monitoring methods, as represented by the number of key performance indicators tracked at the time of the survey and a year earlier.
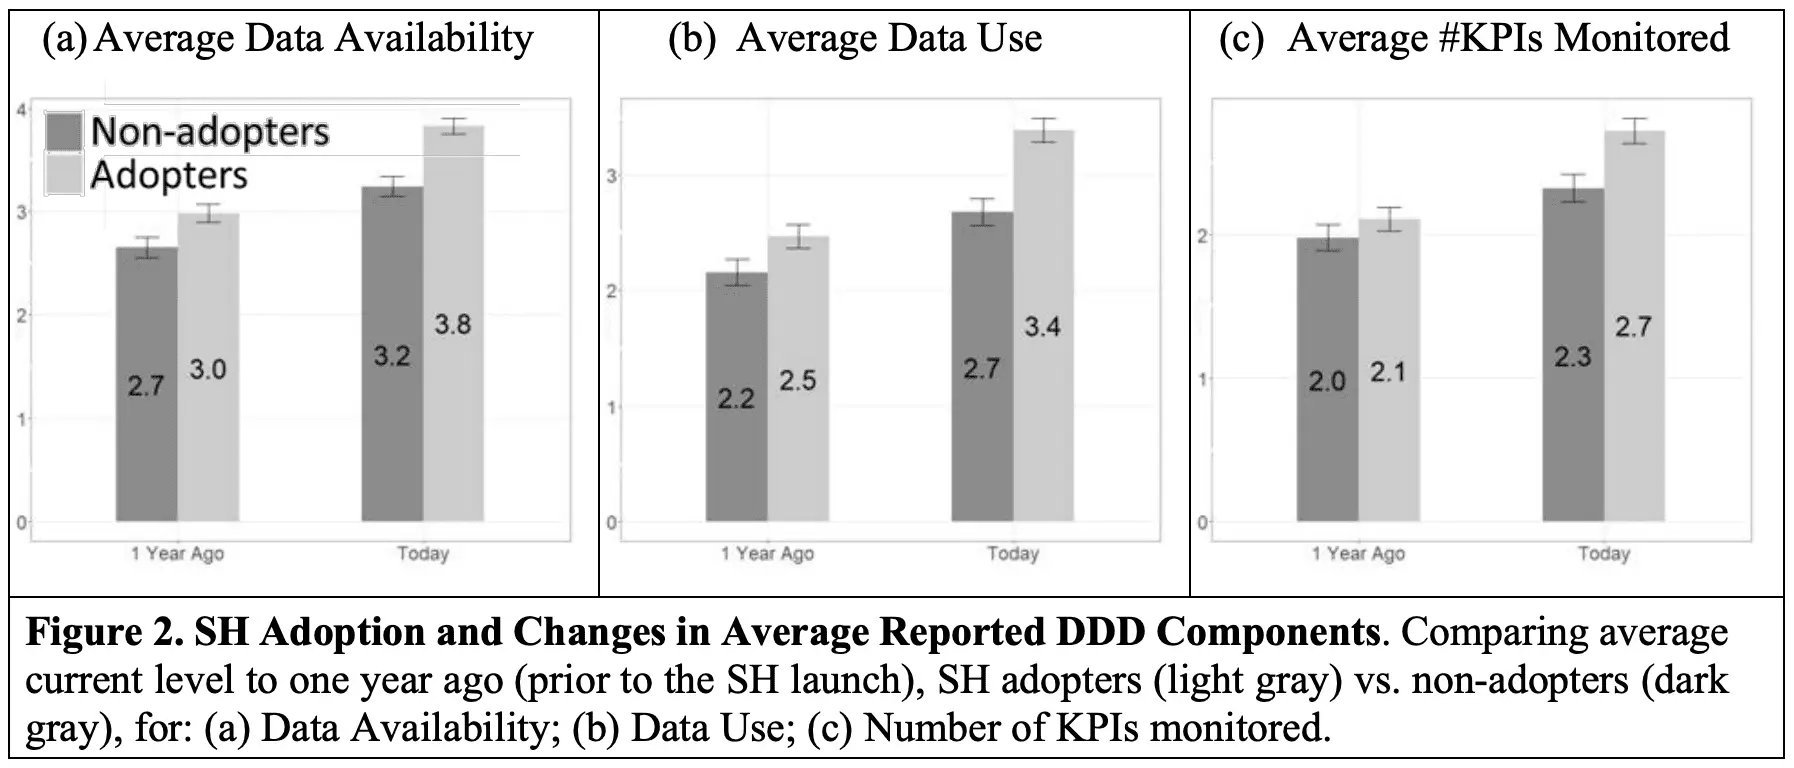
Analyzing the responses, the NBER identified a significant increase in the average availability of data and its use for management decision-making for Seller Hub followers, compared to non-users, during the year of platform implementation.
Experiment formula
The main formula used in the NBER field experiment conducted by eBay Seller Hub is the difference-in-differences (DID) estimator, which compares the change in sales for the treatment group (sellers who had access to the Seller Hub) with the change in sales for the control group (sellers who did not have access to the Seller Hub). The formula for the DID estimator is as follows:
DID = (Y1 — Y0) — (T1 — T0)
where:
- Y1 is the average sales for the treatment group after the intervention (access to the Seller Hub)
- Y0 is the average sales for the treatment group before the intervention
- T1 is the average sales for the control group after the intervention
- T0 is the average sales for the control group before the intervention
By comparing the changes in sales for the treatment and control groups while controlling for other factors that may affect sales, the study was able to estimate the causal impact of the Seller Hub on sales.
"Medical" mathematics
Since the platform deployment took place gradually, as well as the involvement of new participants in the experiment, the NBER ended up with more than two study groups.
- Early adopters opted-in within one week of their respective ramp-up dates.
- Intent-to-treat (ITT) sellers were randomly invited to use Seller Hub, but actual adoption was based on self-selection.
- Treatment-on-the-treated (TOT) sellers who used the opt-in invitation as an instrument for Seller Hub adoption.
Treatment-on-the-treated is a method used in program evaluation to measure the impact of a specific intervention on individuals who received it. In the context of NBER program evaluation, a "treatment" refers to a particular study intended to bring about a desired outcome, increasing sales in our case.
The TOT approach focuses on the impact of the intervention on individuals who received it, as opposed to the effect on all participants in the experiment. To conduct a TOT analysis, researchers compare outcomes for individuals who received the treatment to outcomes for similar individuals who did not. This method allows for isolating the impact of the treatment from other factors that could be influencing the outcome.
Dependent and independent variables
To avoid diving deep into mathematical details and adequately describing the experiment's model, we will have to resort to medicine again. Endogeneity is a process in the body due to internal (endogenous) factors: physiology, age, and gender, and not caused by external influences (medication).
If we imagine the field of the experiment as a human body, then the analogy works. There are variables that the experimenter can change (a request to join the Seller Hub), and there are variables that are measured (sales increasing due to using Seller Hub tools).
In mathematics, these are called the independent and dependent variables. Since we need to understand what affects the dependent variable, we can use the so-called regression analysis (it is intended for this). It will introduce such a thing as regression error — the average distance by which the observed values deviate from the regression line on the graph.
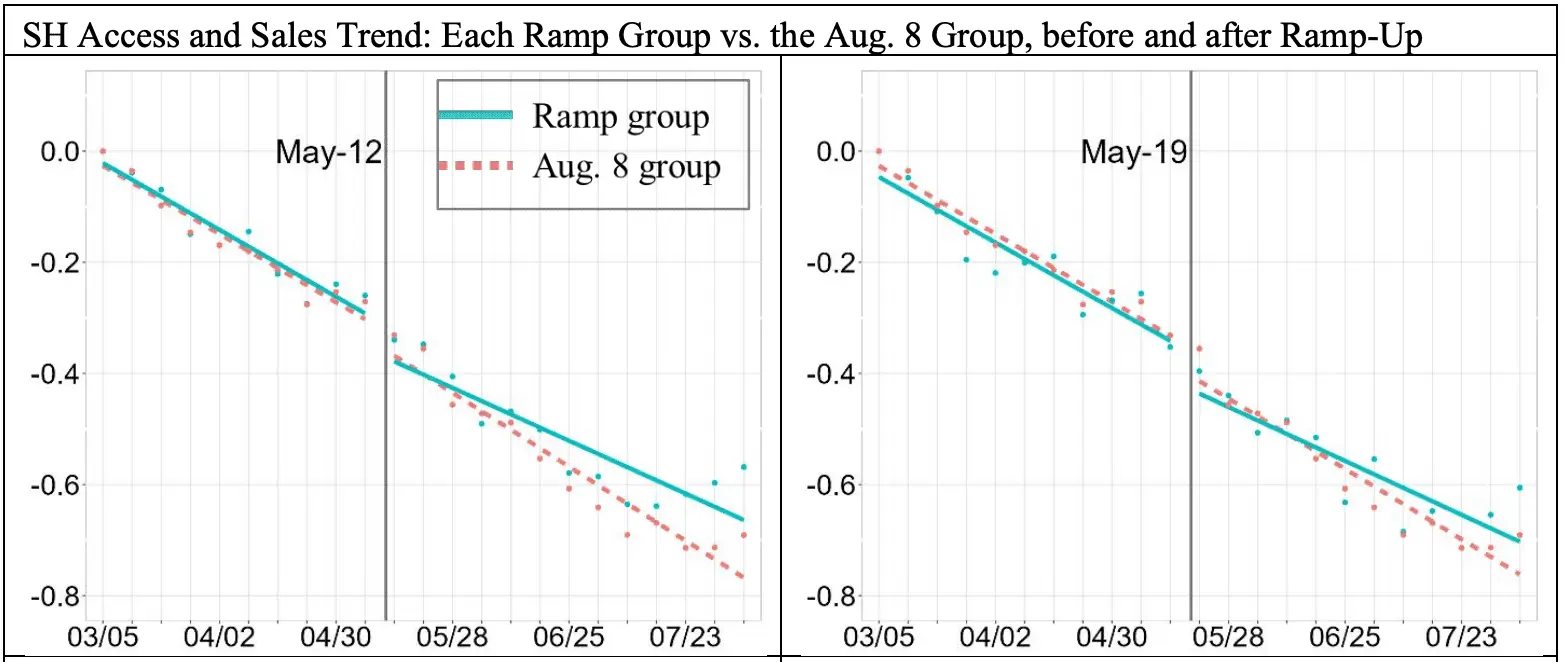
Mathematical endogeneity occurs when the dependent variable is correlated with regression error, which can lead to incorrect estimates of the model coefficients. The so-called IV regression comes to the rescue. It avoids this problem by using instrumental variables unrelated to the regression error but related to the independent variable.
Instrumental variables are chosen to be strongly related to the independent variable but not directly related to the dependent variable. Their use allows for determining the causal relationship between the independent and dependent variables, considering internal and endogenous factors.
How does data-driven decision change?
In the NBER field experiment with eBay Seller Hub, the DDD (daily dollar volume) change was used as a critical outcome variable to measure the platform's impact on seller performance. The formula that describes the relationship between eBay Seller Hub adoption and the change in DDD is as follows:
ΔDDD = β0 + β1Treatment + β2X + ɛ
where:
- ΔDDD is the change in daily dollar volume for a given seller during the treatment period (after receiving access to Seller Hub).
- Treatment is a binary variable that equals one if the seller was assigned to the treatment group (received access to Seller Hub) and 0 if the seller was assigned to the control group.
- X is a vector of control variables that include seller characteristics, such as seller age, size, and previous performance.
- β0, β1 and β2 are parameters that represent the intercept, treatment effect, and coefficients of the control variables, respectively.
- ɛ is the error term, which captures unobserved factors that affect seller performance and are not included in the model.
The coefficient β1 measures the average treatment effect of Seller Hub adoption on DDD. A statistically significant and positive value of it indicates that access led to an increase in daily dollar volume for participating sellers.
The experiment organizers used a logarithmic scale for clarity and accuracy in displaying an extensive range of values on one graph. It also helped visualize the relative changes between values since they were in percentage.
Main Results of the Experiment
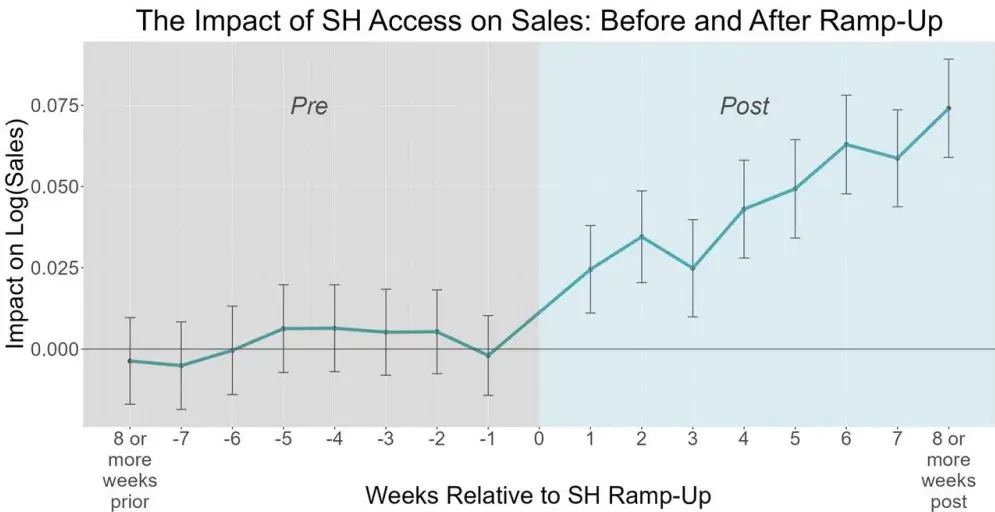
The main numerical result of the experiment is that access to Seller Hub leads to an increase in weekly sales by an average of 3.6%. It is the lower limit of the indicator. The upper one is 12.5%, the second stage impact estimate in the TOT regression.
The impact of Seller Hub on early adopters is estimated to increase weekly sales by an average of 3.7%. The indicator is within the upper and lower limits set by the ITT and TOT estimates, closer to the lower one. It is consistent with the hypothesis that unobservable characteristics of early adopters may correlate with high pre-Seller Hub baseline levels of DDD, resulting in less benefit from implementation.
The most influential decision-making factors
The DDD approach compares the changes in outcomes over time between the treatment group and the control group before and after the treatment period. The results of the DDD analysis showed that several factors drove the increase in sales for the treatment group:
- Sellers who used Seller Hub improved their item specifics, which are the detailed product attributes that help buyers find relevant products. Improved item specifics helped to increase visibility and attract more buyers to their listings.
- Seller Hub users were able to optimize their listings and provide a better buying experience for customers. It led to higher conversion rates and increased sales.
- Sellers on Hub were more likely to update their listings frequently, which helped keep them fresh and relevant.
Specifically, the sales increase due to Seller Hub access is 13.9% higher for sellers in homogeneous categories, and the quantity sold is 4.1% higher, as per the estimated interaction coefficients.
Emphasizing the importance of monitoring
Everything that users did above was, by and large, monitoring the result of Big Data analysis. The report explicitly emphasizes the role of monitoring — in fact, just observing the results alone can achieve a 3.6% weekly increase in sales.
Visiting the "Performance" tab of the Seller Hub is all about monitoring, including reports on sales, traffic, reviews, and seller level. Early adopters average 0.64 visits per week as the highlights of "Performance" are featured on the Seller Hub landing page, the Overview tab. The average early adopter visits 24.89 times per week.
However, visits to the Performance tab provide a more precise measure of performance monitoring than visits to the Overview tab, as the latter provides information on all sales-related tasks (such as orders requiring attention and messaging with customers) and performance graphs and reports in the Performance tab. The number of tab visits is a monitoring measure.
The experiment results show the importance of monitoring managerial performance in creating value on Seller Hub. Moderation analysis breaks down the impact of platform access into individual access impacts: a 2.5% increase in weekly sales and an additional 1.4% increase for each weekly visit to the Performance tab.
Checking the strategy for reliability
To ensure the integrity of the findings—a validation practice that remains the gold standard in 2026—researchers rigorously tested the 2016 experiment against baseline data from 2015.
- Organizers evaluated the 2015 annual sales distribution for each ramp-up group to confirm the segments were sufficiently balanced prior to the launch.
- The statistical distribution density revealed "heavy tails," indicating the presence of rare but massively high-volume sellers that could theoretically skew the averages.
- Despite the presence of these outliers, initial baseline analyses showed no significant mean differences across the randomized samples.
- Researchers applied the Kruskal-Wallis rank sum test to thoroughly investigate any sales discrepancies from the year prior to the launch.
- By systematically excluding one group at a time during testing, they confirmed that the overall experiment results were completely independent of income heterogeneity.
The researchers used the Kruskal-Wallis rank sum test to examine differences between ramp-up groups in annual sales in the year before the launch of the Seller Hub. Excluding one group each time, they concluded that the overall results were independent of the income heterogeneity of the ramp-up groups.

If you want to always be on the cutting edge of technology, book a call.
How does the size of the seller affect it?
Sellers on eBay are internally classified as commercials if they have at least 100 transactions with a total sales income of at least $10,000 in the last 12 months. These B2C sellers are internally divided into three segments based on their revenue:
- entrepreneurs are the lowest-selling classified as B2C, with sales between $10,000 and $120,000
- merchants are the middle segment, with sales between $120,000 and $1 million
- large merchants are the top segment, with sales above $1 million
The experimental sample consists of 165,273 entrepreneurs (89.7%), 17,814 merchants (9.7%), and 1,135 large merchants (0.6%).
Segment analysis showed that access to Seller Hub resulted in a 3% increase in sales for entrepreneurs and 4% for salespeople. The impact on sales in the "Large retail outlets" segment is not statistically significant. Perhaps some big sellers were already using other data analytics tools, so Seller Hub replaced the tool rather than adding new features.
Sales Are Growing at a Constant Price
The experiment provided causal evidence of the impact of data analytics and data-driven decision-making on small and medium businesses by examining a randomized implementation of the eBay Seller Hub tool. Access to it increased the weekly sales of small online stores by an average of 3.6%, raising the number of transactions while prices did not change. The increase comes from improved demand tracking and service quality driven by DDD.
For platform owners, balancing supply and demand with the help of big data analytics tools develops small businesses. The growth of its sales also increases the platform's income from commissions and the registration of new participants (as the process becomes more attractive to SMEs).
The experiment results can be drawn to the attention of the compilers of state programs to support small and medium-sized businesses. The support cost can be reduced while increasing the number of recipients — the help in the form of data analytics tools will be more cost-effective. Associated training ensures SME managers are prepared to monitor performance actively. It remains only to highlight the necessary management methods for successful data-driven decision-making.
Practice Is the Criterion of Truth
By 2026, it is evident that the eBay marketplace reaped significant long-term benefits from both the field experiment and the subsequent NBER publication. By providing access to advanced, scalable tools like the Seller Hub, the platform demonstrated a steadfast commitment to small and medium-sized merchants.
But where did the push to merge scientific research with e-commerce originate? It grew directly out of industry practice. For years, the most forward-thinking traders have partnered with specialized firms like DATAFOREST to uncover critical insights at the intersection of big data science and digital commerce. This dynamic has proven especially vital for small and medium-sized businesses navigating hyper-competitive markets, even though our team routinely tackles massive enterprise projects as well. These ongoing, successful collaborations have definitively cemented the reality that modern commercial success depends on applied data science services, ultimately paving the way for the robust theoretical frameworks we rely on today.
If you want to combine the theory and practice of big data science to increase the efficiency of large and small merchants' work, please get in touch with us. We have proven tools; you have a new task for them. DATAFOREST will teach the algorithm to solve your problems. Get started with our service today.




.webp)
.webp)


